Count people. Understand how places are actually used.
ENVIQON People Counting turns entrance traffic and occupancy signals into practical decisions for retail, facilities, workplaces and public venues. Measure demand, identify peak periods, compare sites and use evidence to improve staffing, space and service levels.
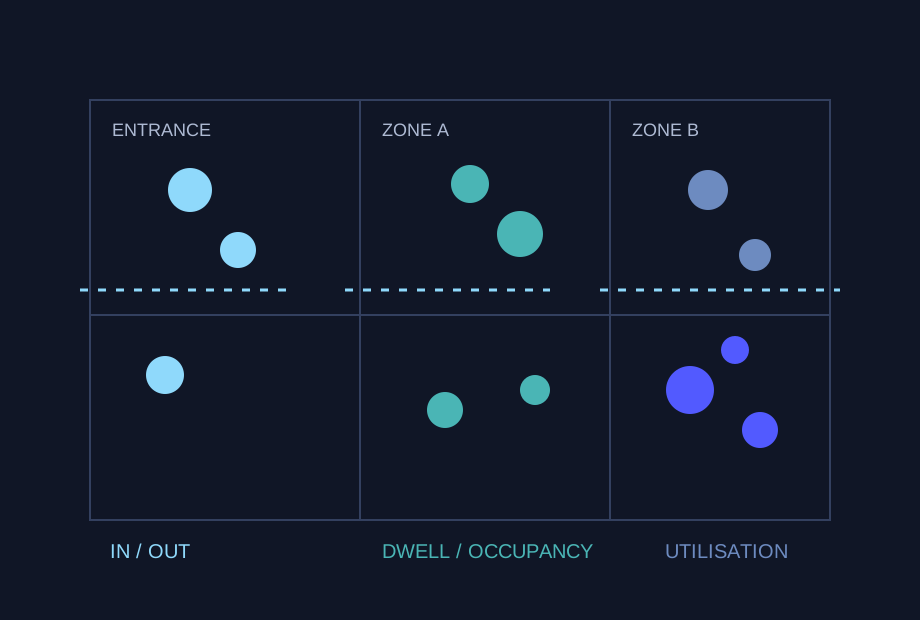
Survey first, then mount the counter to suit the space and accuracy requirement.
Confirm entrance width, ceiling height, traffic direction, zones and any privacy or network constraints before selecting the position.
Use planned ceiling or lintel mounting for entrance counting and wireless ceiling or magnetic placement for occupancy/presence where suitable.
Run controlled passes or occupancy checks to confirm direction, count accuracy, zones and the data feed before handover.
Replace guesswork with measured demand.
People data becomes valuable when it changes a decision. ENVIQON focuses on the operational question behind the count.
Measure entries, exits and traffic through selected entrances, corridors and zones.
See peak periods, occupancy, dwell patterns and differences between locations.
Adjust staffing, cleaning, layouts, opening patterns and facility resources.
Track whether operational changes improve conversion, utilisation or service levels.
Different sectors buy people data for different reasons.
The sensor is the input. The commercial outcome is better deployment of space, staff and resources.
Footfall → conversion intelligence
Compare visitor traffic with transactions, identify peak periods, evaluate campaigns and understand which locations attract the strongest demand.
Occupancy → space decisions
Measure actual use across floors, rooms and shared areas before expanding, consolidating or redesigning workspace.
Usage → service delivery
Use traffic and occupancy to support demand-led cleaning, staffing and resource allocation across customer buildings.
Visitor flow → safer operations
Understand movement and capacity patterns across libraries, museums, education, events and other high-footfall environments.
From raw counts to portfolio intelligence.
In / out counting
Entrance and passage counts with time-based trends and site comparisons.
Live space utilisation
Understand whether selected spaces are occupied and how usage changes through the day.
Peak-time analysis
Identify busy periods to support staffing and operational planning.
Multi-site benchmarking
Compare stores, buildings, floors or entrances through one common dashboard.
Usage-led services
Trigger or review cleaning and facility activity using actual demand rather than fixed schedules.
Bring in business context
Combine people data with sales, bookings, IAQ or other operational information where integration is available.
The right counter depends on the space.
ENVIQON scopes the entrance width, mounting height, environment and analytics requirement before selecting hardware.
Use anonymous counting technologies where appropriate and assess each deployment against customer policy and applicable privacy requirements. The selected sensor technology and configuration determine the privacy characteristics.
High-accuracy entrance counting
For retail, building entrances and other locations where bidirectional counting, regional analysis or dwell-time insight is required.
Occupancy + multi-zone use
For workplaces and larger indoor areas where the requirement goes beyond a simple doorway count.
Passage and corridor counting
For traffic measurement through passages and selected internal circulation points.
Flexible occupancy deployment
For selected rooms or areas where wireless occupancy sensing is the better fit for the building and use case.
Gateway where it makes sense. Edge integration where it doesn't.
People-sensing projects are not all technically identical. Wireless occupancy and selected people-counting sensors can use the ENVIQON gateway architecture, while some high-accuracy entrance counters use other network interfaces and are integrated into the same ENVIQON analytics layer.
One dashboard should not force every physical sensor to use the same transport.
Strong where physical demand affects revenue or operating cost.
Retail, workplace and facilities intelligence
Lead with measurable footfall, portfolio space utilisation and evidence for facilities decisions.
- Retail chains and shopping environments
- Corporate real estate and hybrid workplaces
- Facilities-management portfolios
- Universities, libraries and cultural venues
Retail performance and enterprise facilities
Lead with traffic visibility, staffing efficiency, space utilisation and multi-site operational control.
- Banks and branch networks
- Shopping centres and retail chains
- Corporate headquarters and telecoms
- Hotels, universities and public venues
Measure one real location before rolling out.
Scope one entrance, room or operational zone. Validate the sensor placement, data quality, dashboard, reporting and the decisions the data can support.